In the ever-evolving landscape of data science and analysis, the ability to transform, manipulate, and extract insights from data is nothing short of an art form. Data is often messy, diverse, and rarely fits neatly into the structure we desire. That’s where Pandas, a versatile and powerful Python library, comes into play.
In this multi-part series, we embark on a journey through the intricacies of Pandas, equipping you with the skills to master the art of data manipulation. This first part serves as your gateway into the world of Pandas, setting the stage for an in-depth exploration of its capabilities.

Pandas is not just another Python library; it’s a game-changer for anyone dealing with data. Whether you’re a data scientist, analyst, or even a curious enthusiast, this library empowers you to effortlessly wrangle data, perform complex operations, and extract valuable insights, all within the Python ecosystem.
Over the course of this comprehensive guide, we’ll cover everything from the fundamentals to advanced techniques, ensuring you have a robust foundation in this library. Each part of the series will build upon the last, gradually revealing the full potential of this indispensable tool for data manipulation.
So, if you’re ready to dive into the world of Pandas and unlock the secrets of efficient data manipulation, fasten your seatbelt because this journey is about to begin. Together, we’ll unravel the artistry of this library and equip you with the skills to transform raw data into actionable insights. Without further ado, let’s embark on this data manipulation adventure with Pandas as our trusty guide.
Let’s begin our journey by unraveling the story of Pandas, a remarkable Python library that has transformed the way we handle data.
So, what exactly is Pandas, and how did it come to be?
Pandas, like its namesake, isn’t a creature of the wild but rather a creation of the digital age. It’s a library that provides powerful tools for data manipulation and analysis in Python. If data analysis were a kitchen, this particular library would be the chef’s knife that makes slicing, dicing, and serving up data a breeze.
Pandas, developed by Wes McKinney, made its debut in 2008 while he was working as a financial analyst. Frustrated with the limitations of data analysis tools available at the time, he decided to craft a new solution. The result was Pandas, born out of a desire to streamline and enhance data handling capabilities in Python.
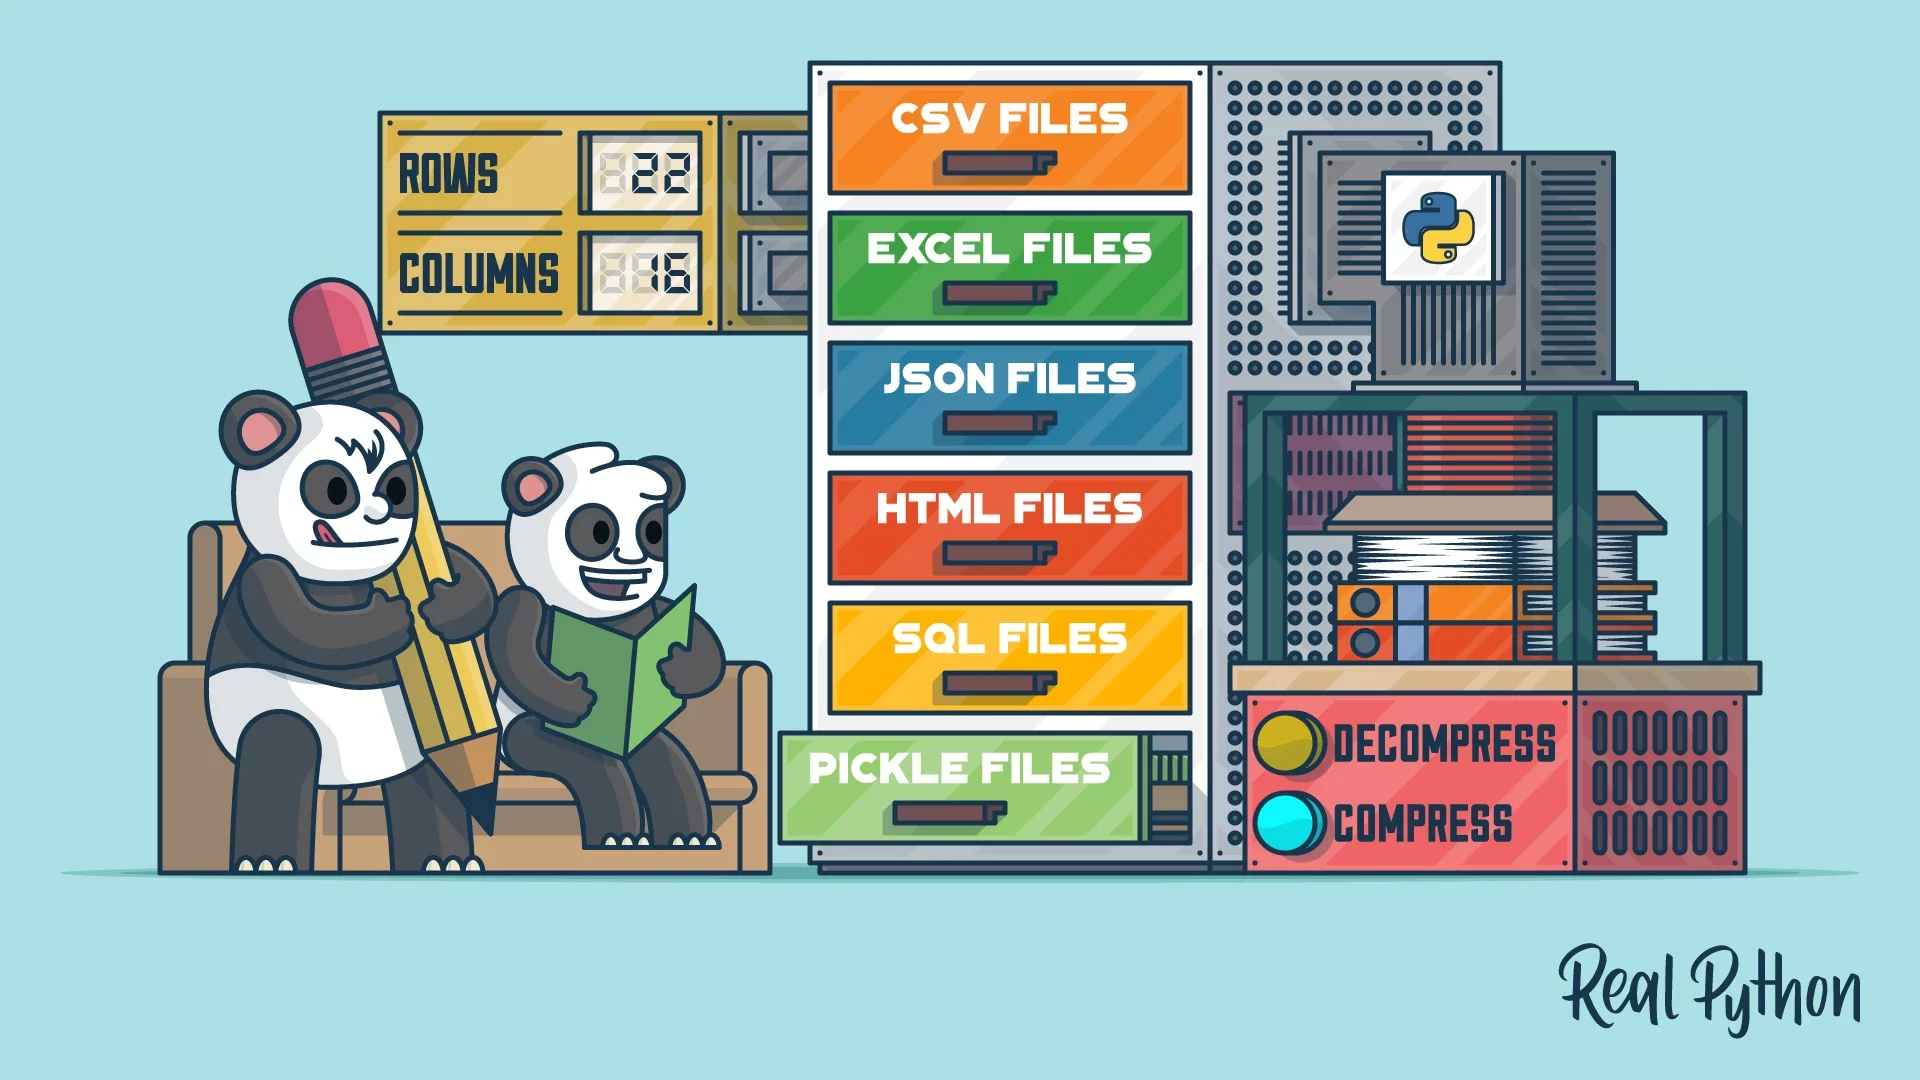
Wes McKinney chose the name ‘Pandas’ as a portmanteau of “Panel Data,” a term widely used in econometrics and multidimensional data analysis. This name choice reflects Pandas’ initial focus on providing data structures for handling tabular and time-series data, a core component of panel data analysis.
Over the years, this library has evolved from its humble beginnings into an essential tool for data scientists, analysts, and researchers worldwide. Its user-friendly and intuitive interface has played a pivotal role in democratizing data analysis, making it accessible to both experts and newcomers in the field.
Pandas has become the go-to library for data manipulation in Python because it excels at simplifying complex tasks. Whether you need to clean, transform, merge, or analyze data, this library provides an arsenal of functions and methods that feel like wielding magic in the world of data.
Knowing the background of this library not only adds a touch of intrigue but also helps you appreciate its design philosophy and evolution. This knowledge lays the foundation for a deeper understanding of why this library does what it does and how it can empower you in your data manipulation endeavors.
Now that we’ve explored the roots of this library, it’s time to dive into the practical side of things. In the next section, we’ll walk you through the installation and setup of Pandas, so you can start wielding this powerful tool with confidence.
With our understanding of Pandas’ origins now firmly in place, it’s time to roll up our sleeves and get started with the practical side of things. In this section, we’ll walk you through the installation and setup of this library, ensuring you have the tools you need to begin your data manipulation journey.
Before we can dive into Pandas, we need to ensure you have Python installed on your system. Most modern systems come with Python pre-installed, but if not, you can easily download and install it from the official Python website. Be sure to select the latest version for the best
Once Python is up and running, installing Pandas is a breeze. We’ll use Python’s package manager, pip, to do this. Open your command prompt or terminal and type the following command:
pip install pandas
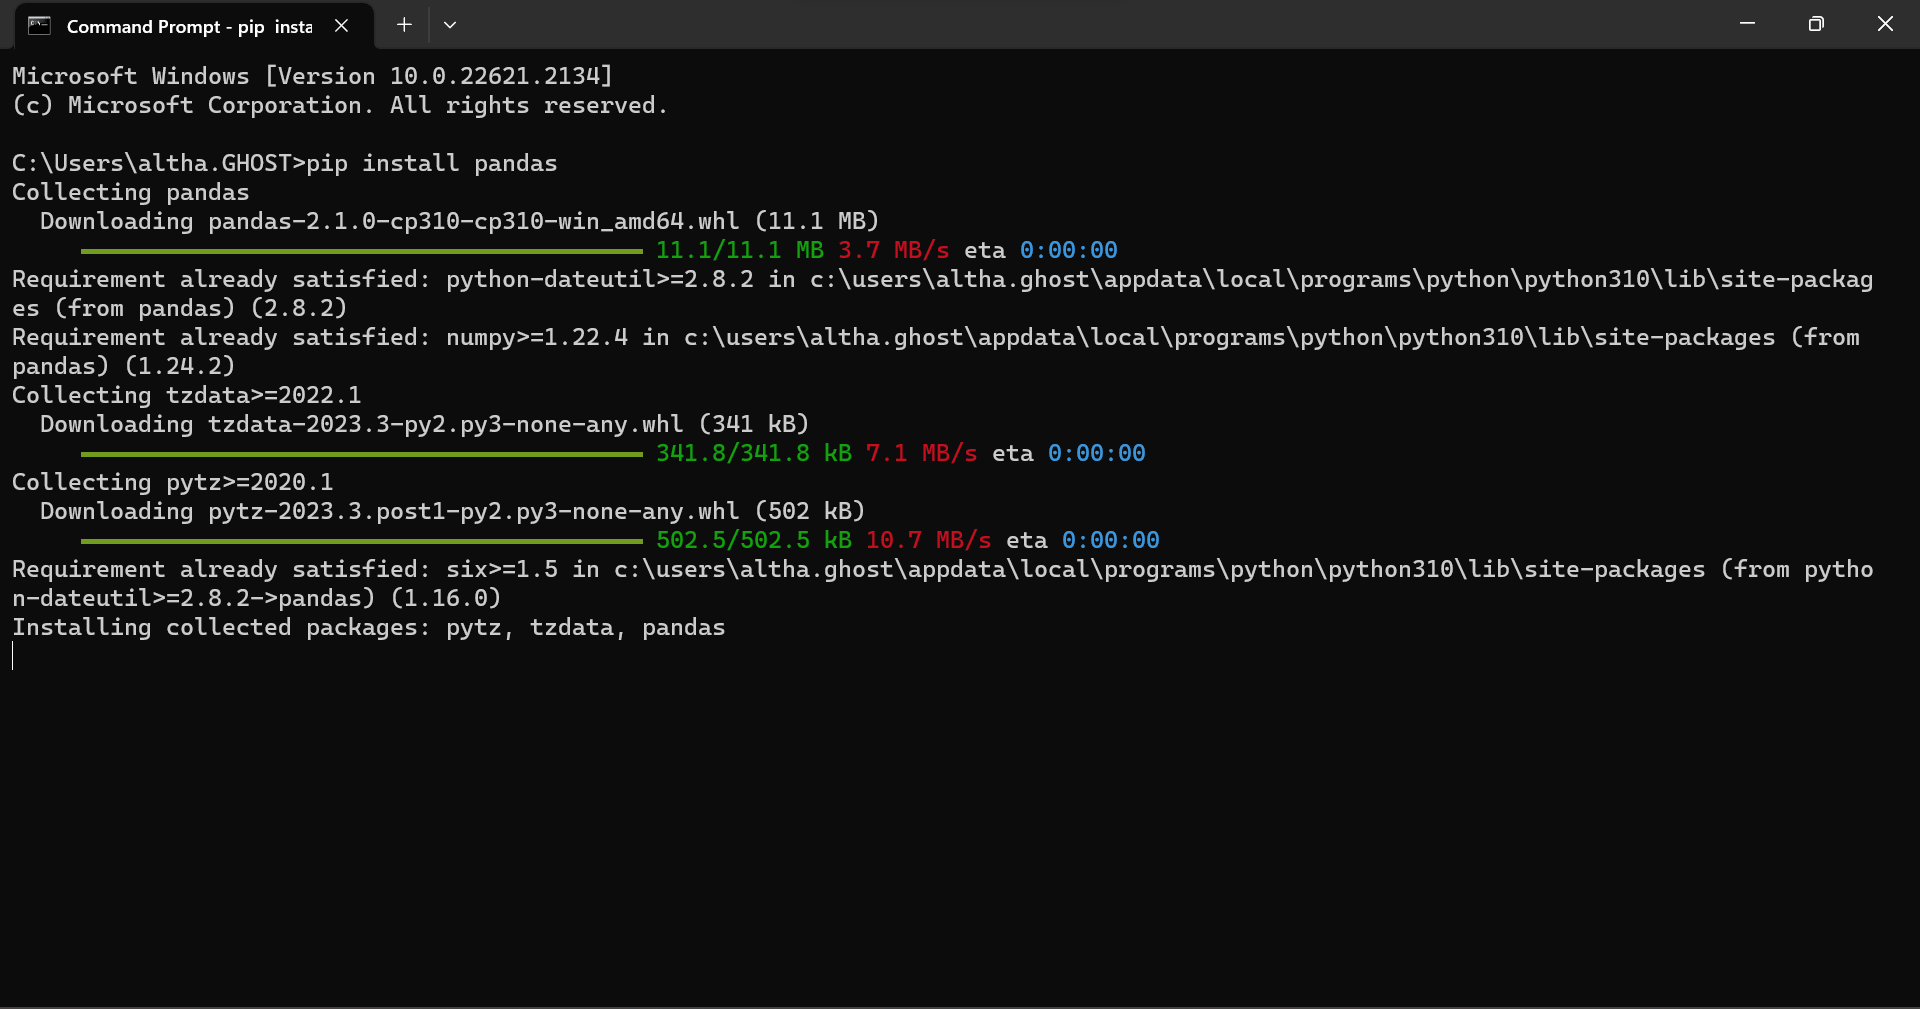
Hit ‘Enter,’ and watch as the library magically appears on your system.
To ensure that Pandas has been successfully installed, let’s write a quick Python script to import it. Open your preferred code editor and create a new Python file (e.g., installation_check.py). Then, add the following lines of code:

Save the file and run it by executing python installation_check.py in your command prompt or terminal. If you see the “Pandas installation successful!” message, congratulations—you’re now armed with Pandas!
To work effectively with this library, consider using a development environment such as Jupyter Notebook or a code editor like Visual Studio Code or PyCharm. These environments offer features that enhance your coding experience and make it easier to visualize and analyze data.
Now that Pandas is gracefully installed on your system, let’s take our first steps into the realm of data manipulation. In this section, we’ll explore how to import the library into your Python environment and introduce you to some common coding conventions that will make your Pandas journey smooth and elegant.
To wield the power of Pandas, you need to import it into your Python script or environment. Python’s simplicity shines through in this step. Here’s how you do it:

In this single line, we accomplish two crucial things:
With this alias in place, you can access the library functions and classes using the concise pd prefix. It’s a convention widely adopted by the Pandas community and will save you keystrokes and improve code clarity throughout your data manipulation journey.
Two fundamental data structures in this library are the DataFrame and the Series. Let’s briefly introduce them, as they will be your companions in the world of data manipulation.
DataFrame: Think of a DataFrame as a spreadsheet or a table. It’s a two-dimensional, tabular data structure that can store data of various types. You can imagine it as a collection of Series objects aligned by a common index.
Series: A Series, on the other hand, is like a single column of data. It’s a one-dimensional labeled array capable of holding any data type. When combined, Series form the columns of a DataFrame.
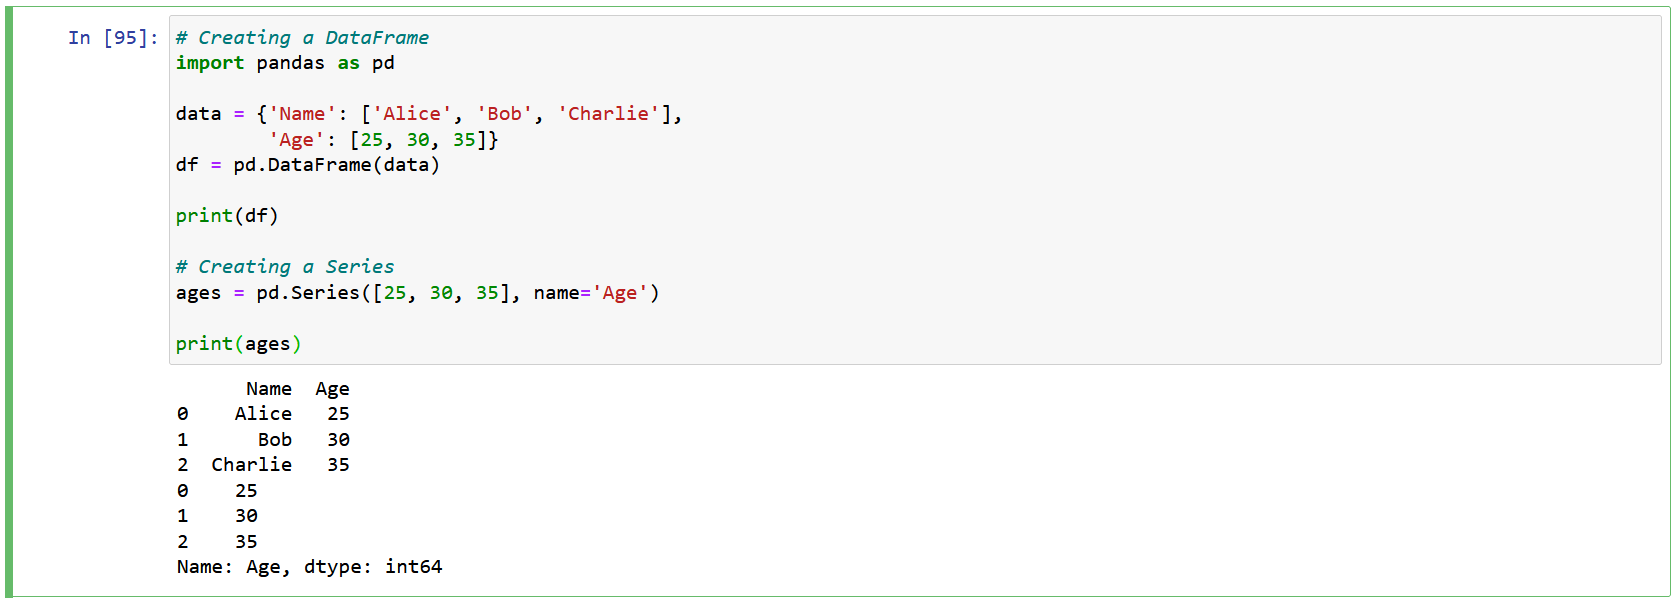
In this section, you’ve learned the essential steps to import this library into your Python environment and discovered the commonly used ‘pd’ alias. You’ve also been introduced to the fundamental data structures: DataFrame and Series.
You’ve embarked on an exciting journey into the world of Pandas, Python’s data manipulation powerhouse. By delving into its’ history, you’ve gained insight into its evolution from a frustrated analyst’s idea to an essential tool for data professionals.
With this library now seamlessly integrated into your system, the ‘import pandas as pd’ convention serves as your entry point into the Pandas universe, streamlining interactions with this dynamic library.
You’ve also met the library’ fundamental data structures, the versatile DataFrame and the streamlined Series. These will be your primary tools as you navigate data manipulation and analysis.
As you continue through this series, you’ll explore data loading, cleaning, advanced selection techniques, and data visualization with this library. Each installment enhances your Pandas skills, empowering you to transform raw data into actionable insights.
Your Pandas journey has only just begun, promising a wealth of data exploration and newfound expertise. Stay tuned for more Pandas insights and start unleashing the full potential of your data analysis endeavors! if you enjoyed the blog follow 1stepgrow.
We provide online certification in Data Science and AI, Digital Marketing, Data Analytics with a job guarantee program. For more information, contact us today!
Courses
1stepGrow
Terms
Anaconda | Jupyter Notebook | Git & GitHub (Version Control Systems) | Python Programming Language | R Programming Langauage | Linear Algebra & Statistics | ANOVA | Hypothesis Testing | Machine Learning | Data Cleaning | Data Wrangling | Feature Engineering | Exploratory Data Analytics (EDA) | ML Algorithms | Linear Regression | Logistic Regression | Decision Tree | Random Forest | Bagging & Boosting | PCA | SVM | Time Series Analysis | Natural Language Processing (NLP) | NLTK | Deep Learning | Neural Networks | Computer Vision | Reinforcement Learning | ANN | CNN | RNN | LSTM | Facebook Prophet | SQL | MongoDB | Advance Excel for Data Science | BI Tools | Tableau | Power BI | Big Data | Hadoop | Apache Spark | Azure Datalake | Cloud Deployment | AWS | GCP | AGILE & SCRUM | Data Science Capstone Projects | ML Capstone Projects | AI Capstone Projects | Domain Training | Business Analytics
WordPress | Elementor | On-Page SEO | Off-Page SEO | Technical SEO | Content SEO | SEM | PPC | Social Media Marketing | Email Marketing | Inbound Marketing | Web Analytics | Facebook Marketing | Mobile App Marketing | Content Marketing | YouTube Marketing | Google My Business (GMB) | CRM | Affiliate Marketing | Influencer Marketing | WordPress Website Development | AI in Digital Marketing | Portfolio Creation for Digital Marketing profile | Digital Marketing Capstone Projects
Jupyter Notebook | Git & GitHub | Python | Linear Algebra & Statistics | ANOVA | Hypothesis Testing | Machine Learning | Data Cleaning | Data Wrangling | Feature Engineering | Exploratory Data Analytics (EDA) | ML Algorithms | Linear Regression | Logistic Regression | Decision Tree | Random Forest | Bagging & Boosting | PCA | SVM | Time Series Analysis | Natural Language Processing (NLP) | NLTK | SQL | MongoDB | Advance Excel for Data Science | Alteryx | BI Tools | Tableau | Power BI | Big Data | Hadoop | Apache Spark | Azure Datalake | Cloud Deployment | AWS | GCP | AGILE & SCRUM | Data Analytics Capstone Projects
Bangalore:
Anjanapura | Arekere | Basavanagudi | Basaveshwara Nagar | Begur | Bellandur | Bommanahalli | Bommasandra | BTM Layout | CV Raman Nagar | Electronic City | Girinagar | Gottigere | Hebbal | Hoodi | HSR Layout | Hulimavu | Indira Nagar | Jalahalli | Jayanagar | J. P. Nagar | Kamakshipalya | Kalyan Nagar | Kammanahalli | Kengeri | Koramangala | Kothnur | Krishnarajapuram | Kumaraswamy Layout | Lingarajapuram | Mahadevapura | Mahalakshmi Layout | Malleshwaram | Marathahalli | Mathikere | Nagarbhavi | Nandini Layout | Nayandahalli | Padmanabhanagar | Peenya | Pete Area | Rajaji Nagar | Rajarajeshwari Nagar | Ramamurthy Nagar | R. T. Nagar | Sadashivanagar | Seshadripuram | Shivajinagar | Ulsoor | Uttarahalli | Varthur | Vasanth Nagar | Vidyaranyapura | Vijayanagar | White Field | Yelahanka | Yeshwanthpur
Other Top Cities:
Mumbai | Pune | Nagpur | Delhi | Gurugram | Chennai | Hyderabad | Coimbatore | Bhubaneswar | Kolkata | Indore | Jaipur and More