Tools and Techniques for Data Science

Table of Contents

Introduction:

Feeling overwhelmed by buzzwords like “big data,” “AI,” and “machine learning”? Don’t worry, you’re not alone! Data science might seem intimidating due to its complex tools and techniques. It requires backgrounds in programming, statistics, math, probability, and more. However, fear not! Learning data science can be fun, exciting, and insightful. It’s filled with discoveries and even some epic fails. So, grab your calculator, get your caffeine fix, and let’s dive into the world of data science together!


What is Data Science:


Before we dive into the tools and techniques of data science, let’s take a brief look at what data science is all about.

Tools and Techniques for Data Science

Data Science combines various techniques, tools, and algorithms to extract insights from data. It merges statistics, mathematics, computer science, and domain expertise to analyze complex data sets. The goal is to derive actionable insights that inform decision-making across industries such as healthcare, finance, and transportation. The field’s importance has surged alongside the data explosion, creating ample career opportunities for skilled individuals.


Tools and Techniques for Data Science:


Now, let’s closely examine the fundamental tools and techniques in data science. We’ll delve into their importance and why they ensure success. We’ll cover programming, visualization, and model deployment, providing essential knowledge for skilled data scientists.


  1. Programming: Process of writing codes and building software applications to handle and process data
  2. Statistics: Analysis and interpretation of data, includes hypothesis testing, regression analysis, and Bayesian analysis
  3. Maths & Probability: Development of mathematical models and algorithms to predict and explain patterns in data
  4. DBMS (Database Management System): To store, organize, and manage large datasets
  5. Visualization: represent and communicate insights and findings from data through charts, graphs, and other visualizations
  6. Model Deployment: deploy machine learning models in production environments, allowing them to make real-time predictions on new data
  7. Storytelling: effectively communicate insights and findings from data in a way that is understandable and actionable for stakeholders.

Programming for Data Science

Programming languages play a vital role in data science. They enable data scientists to handle large datasets and perform advanced statistical analysis. Data science demands manipulating and analyzing substantial data, and programming languages equip data scientists with effective tools.

Tools and Techniques for Data Science

Python, R, and SQL play pivotal roles in data manipulation, statistical analysis, and modeling. These languages empower data scientists to manage large datasets, automate processes, and perform advanced statistical analysis, such as predictive modeling, machine learning, and natural language processing.


Programming languages streamline workflows, automate tasks, and reduce manual effort in data science, allowing data scientists to concentrate on crucial tasks.


Which programming languages are primarily employed in data science?


There are several programming languages used in data science, and some of the most popular ones are:


  1. Python: Python is a high-level programming language that is easy to learn and widely used in data science. It offers a vast array of libraries and frameworks for data manipulation, visualization, and machine learning, making it an ideal choice for data science projects.
  2. R: R is a programming language designed specifically for data analysis and visualization. It offers a wide range of packages and functions for statistical analysis, data manipulation, and visualization, making it a popular choice for statisticians and data scientists.
  3. SQL: Structured Query Language (SQL) is a programming language used to manage and manipulate relational databases. It is widely used in data science for querying, retrieving, and transforming data from databases.
  4. Java: Java is a popular programming language used in data science for its scalability, robustness, and portability. It offers a vast array of libraries and frameworks for data analysis, machine learning, and data visualization.
  5. Scala: Scala is a general-purpose programming language that is highly interoperable with Java. It is widely used in data science for its support of functional programming, data processing, and machine learning.


Each of these programming languages offers unique features and capabilities that make them useful in data science. However, Python and R are currently the most widely used languages in data science due to their vast libraries, ease of use, and popularity in the data science community.


Which are the primary libraries commonly utilized in data science?

A library refers to a collection of pre-written code that can be used by developers to simplify their work and perform complex tasks more easily. These libraries are typically created by other developers and are made available for others to use under an open-source license.

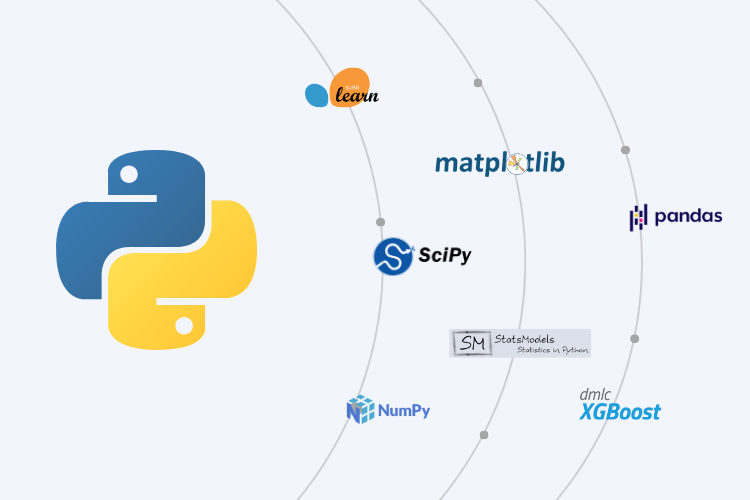
Here are some of the main libraries used in data science for both Python and R:

Tools and Techniques for Data Science

For Python:


  1. NumPy: a library that provides support for numerical operations and array manipulation.
  2. Pandas: a data manipulation library that provides a wide range of tools for data cleaning, preparation, and transformation.
  3. Matplotlib: a data visualization library that allows users to create a variety of plots and charts.
  4. Scikit-learn: a machine learning library that provides a unified interface for various classification, regression, and clustering algorithms.
  5. TensorFlow: a machine learning library that provides support for deep learning algorithms and neural networks.


For R:


  1. ggplot2: a data visualization library that allows users to create highly customizable and aesthetically pleasing graphs.
  2. dplyr: a data manipulation library that provides a concise syntax for filtering, selecting, and aggregating data.
  3. caret: a machine learning library that provides a unified interface for various classification and regression algorithms.
  4. tidyr: a library that makes it easy to tidy data by converting it from wide to long format or vice versa.
  5. shiny: a web application framework that allows users to create interactive dashboards and applications with R.


These are just a few of the many libraries available in R and Python for data science. Depending on the specific needs of a project, there are many more libraries that can be used to perform a wide range of data analysis and modelling tasks.

Mathematics for Data Science:

Mathematics serves as a toolbox for data scientists to uncover complex data insights. Each concept, like a tool, has a specific purpose. Linear algebra manipulates high-dimensional data, while calculus optimizes models. Probability and statistics aid in predictions and conclusions. Mastering these concepts empowers data scientists to unravel data mysteries and make impactful decisions.


  • Role of Statistics in Data Science
Tools and Techniques for Data Science

What is statistics?

Statistics involves collecting, analyzing, and interpreting data. It summarizes data, infers from samples, and tests hypotheses using models.

In simpler terms, statistics makes sense of numerical data. It identifies patterns, trends, and relationships. It draws conclusions about data, like analyzing survey results or evaluating business performance.


How are statistics and data science related?

Statistics and data science closely connect. Statistics offers theory and methods for data science. Data science uses statistical techniques for insights. Statistics enables understanding data through techniques like hypothesis testing and regression analysis. It aids decisions based on statistical models.


Key statistical concepts in data science


There are several key statistical concepts that are central to data science. These include:


  1. Descriptive statistics: These are methods for summarizing and describing data, such as measures of central tendency (mean, median, mode) and measures of variability (range, variance, standard deviation).
  2. Inferential statistics: These are methods for making inferences about a population based on a sample of data, such as hypothesis testing and confidence intervals.
  3. Probability theory: This is the branch of mathematics that deals with the likelihood of events occurring. Probability theory is used in data science to model random processes and uncertainty.
  4. Regression analysis: This is a statistical technique used to model the relationship between a dependent variable and one or more independent variables.


By understanding these key statistical concepts and techniques, data scientists can analyse and interpret data, build accurate models, make informed decisions, and communicate results effectively.


  • Role of Probability in Data Science
Tools and Techniques for Data Science

Probability is the branch of mathematics that deals with the likelihood of events occurring. In simpler terms, probability is the measure of how likely it is that an event will happen.


How are probability theory and data science related?


Probability theory and data science are intricately linked, with probability theory forming the bedrock for numerous statistical methods and models in data science.

In data science, probability theory serves to model and dissect uncertainty and randomness within data. It enables the assessment of probability distributions for datasets, gauging the likelihood of specific values occurring. This aids in forecasting future outcomes and approximating event probabilities.


Likewise, probability theory plays a pivotal role in statistical inference—the art of drawing conclusions about populations from data samples. Here, it assists in calculating the likelihood of observing certain data under a given hypothesis. These insights drive conclusions about the broader population.


Furthermore, probability theory is a cornerstone of machine learning—a data science subset employing algorithms to discern patterns and correlations in data. Many machine learning algorithms rely on probabilistic models to heighten their effectiveness and versatility.

DBMS (Database Management Systems) in Data Science:

As the name suggests, Data Science is all about data. It involves the storage, organization, and manipulation of large amounts of data to extract valuable insights from them. This is where database management systems (DBMS) come into play. DBMS provide a platform for storing and managing large datasets in a structured manner. Making it easier for data scientists to access and analyse the data efficiently.

Tools and Techniques for Data Science

In data science, DBMS are used to store and manage various types of data such as structured, unstructured, and semi-structured data. They also provide tools for querying, searching, and updating data in real-time, which is crucial for data analysis. DBMS also offer features such as data backup, recovery, and security, ensuring data integrity and protection.


Introducing SQL (Structured Query Language)

SQL, or Structured Query Language, is an essential component of modern database management systems and is particularly important in the context of data science. At its core, SQL provides a standardized way of accessing and manipulating data stored in

databases. This is critical for data scientists who need to extract, transform, and analyse data in order to gain insights and make data-driven decisions.


SQL’s importance in data science cannot be overstated. It allows data scientists to write powerful queries that can filter, sort, group, and aggregate large datasets in a matter of seconds. This helps to streamline the data exploration and analysis process, allowing data scientists to focus on gaining insights rather than wrangling with the data itself.


Moreover, SQL is highly versatile and can be used with a variety of database management systems, including both traditional RDBMS and modern NoSQL databases. This makes it a highly adaptable tool that can be used in a wide range of data science applications.


In short, SQL is a foundational tool that every aspiring data scientist should master. By doing so, they will be able to quickly and easily access and manipulate data, which is essential for unlocking valuable insights and driving data-driven decision-making.

Data Visualization in Data Science:

Data visualization is a critical component of data science that allows us to communicate complex data insights in a way that is easy to understand and interpret. With the increasing amount of data generated by businesses and organizations, data visualization has become an essential tool for data scientists to uncover patterns, trends, and insights from large and complex datasets.

Tools and Techniques for Data Science

What is Data visualization?

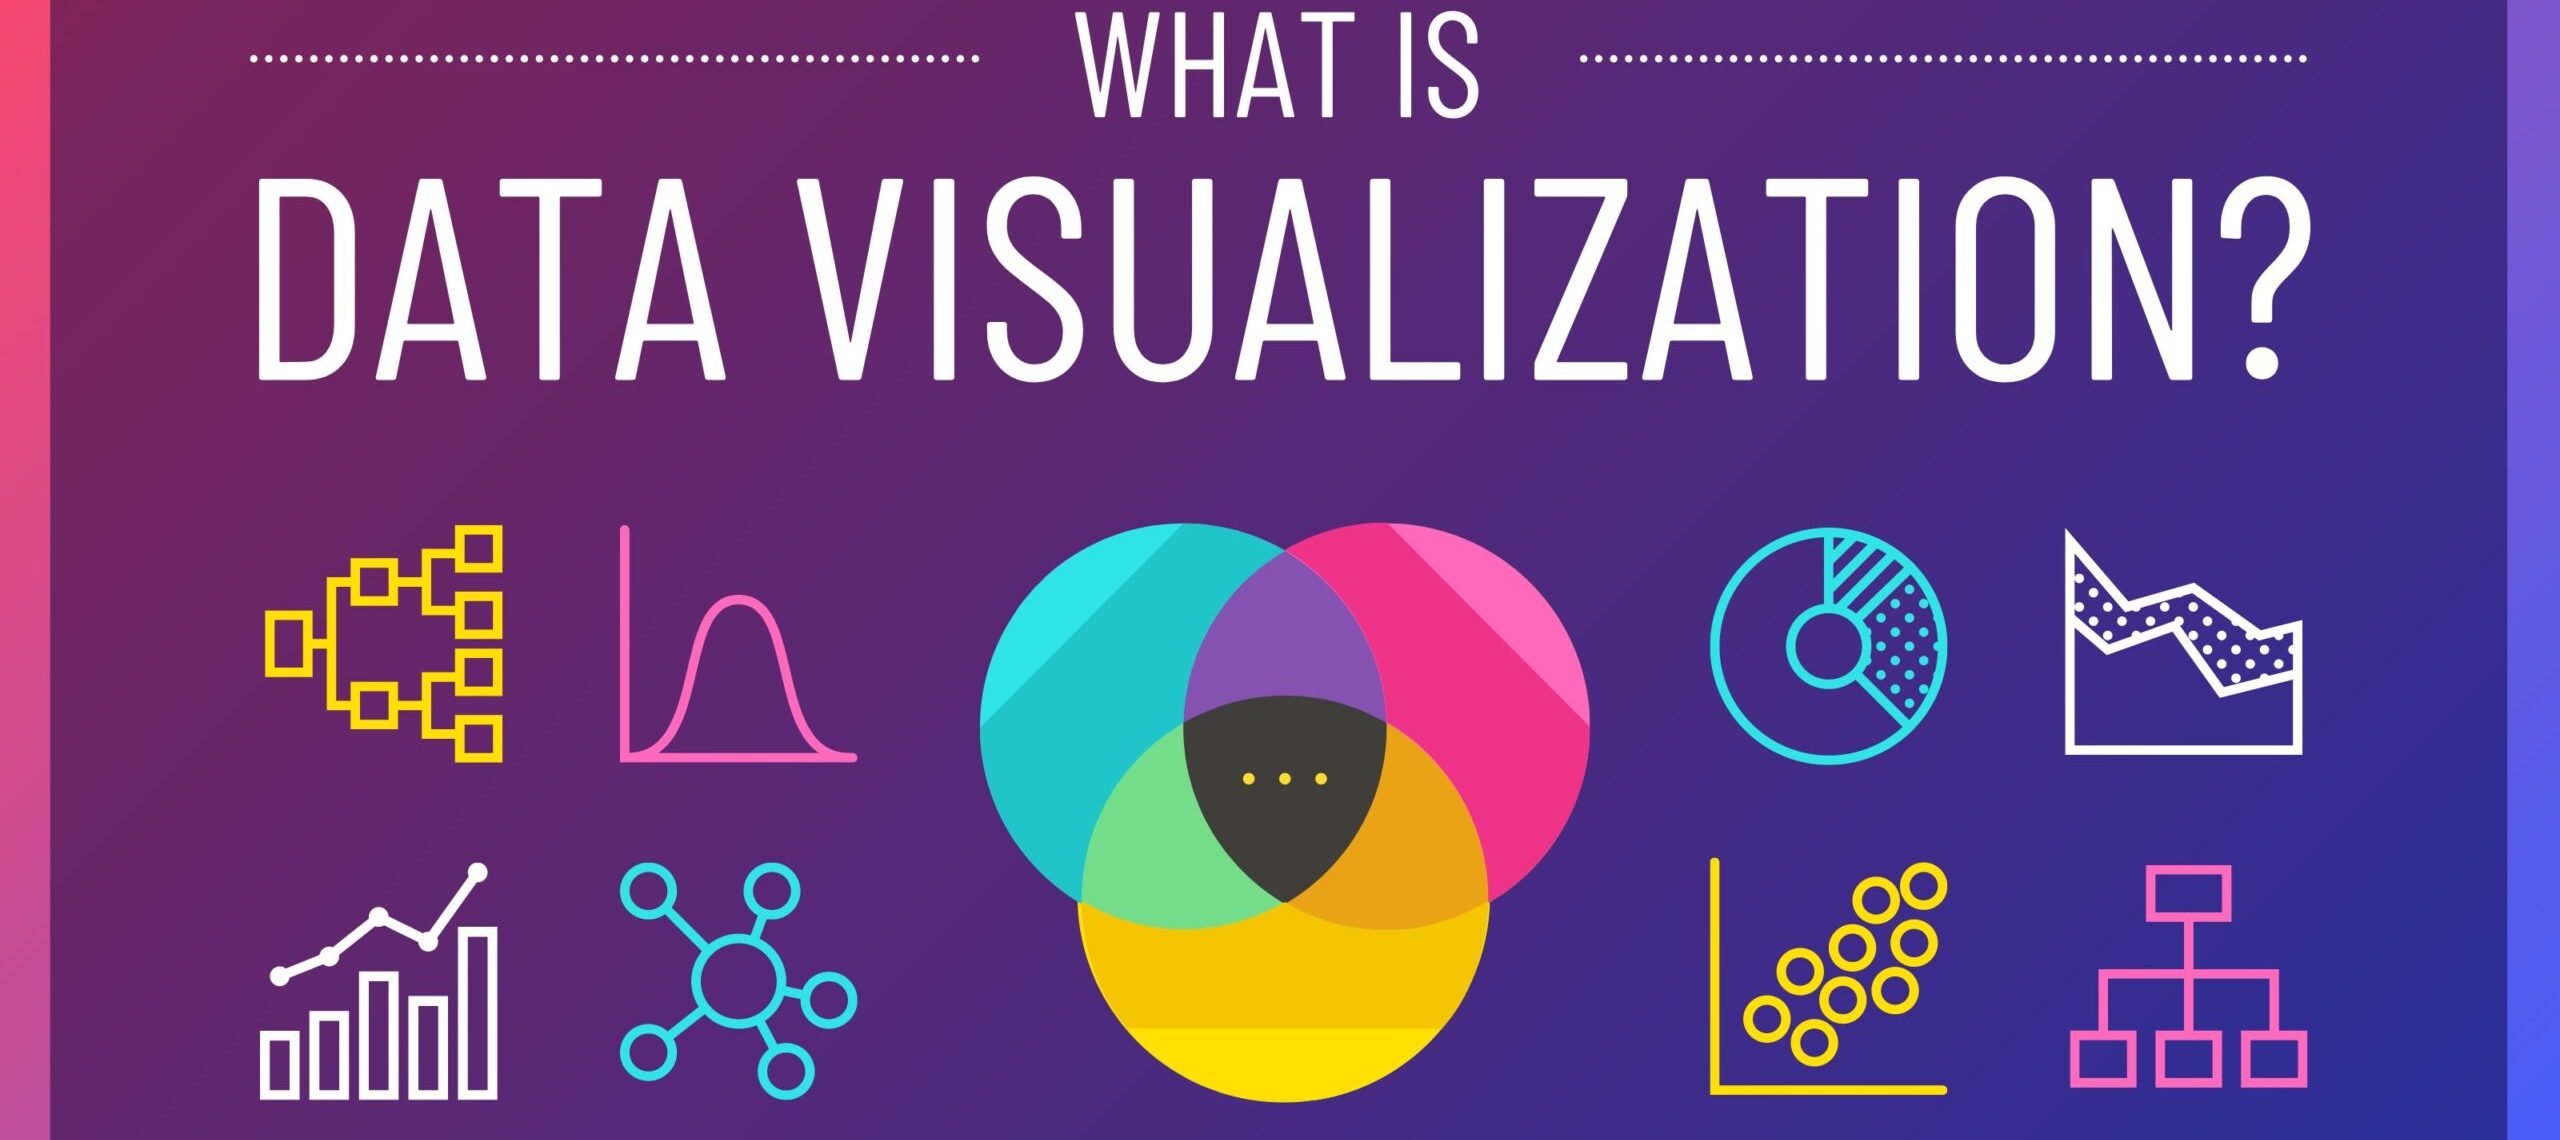
Data visualization is pivotal in portraying data through graphical or visual mediums. This approach uncovers patterns, trends, and insights that raw data alone may not unveil. Incorporating graphical elements such as charts, graphs, maps, and tables, data visualization simplifies data comprehension.


By crafting both enlightening and visually captivating visualizations, data scientists can adeptly convey their discoveries to stakeholders, facilitating well-informed decision-making.


Various tools serve data visualization in data science, encompassing Tableau and Python libraries like Matplotlib, Seaborn, and Plotly. These tools empower users to craft an extensive array of interactive visualizations, charts, and graphs, thereby facilitating data exploration and analysis.


Depending on the project’s distinct requirements, data scientists can select and deploy one or a combination of these tools to generate impactful and informative data visualizations.

Model Deployment in Data Science:

Model deployment is the final stage in the data science workflow, in which a data scientist takes the model that they have built and puts it into use within a real-world system.


What is Model Deployment?

Model deployment in data science refers to the process of taking a trained machine learning model and making it available for use in real-world applications. To put it simply, once a data scientist has developed a model that can accurately predict certain outcomes based on input data, the model needs to be “deployed” so that it can actually be used to make those predictions.

Tools and Techniques for Data Science

Story Telling in Data Science:

Steps involved in model deployment:


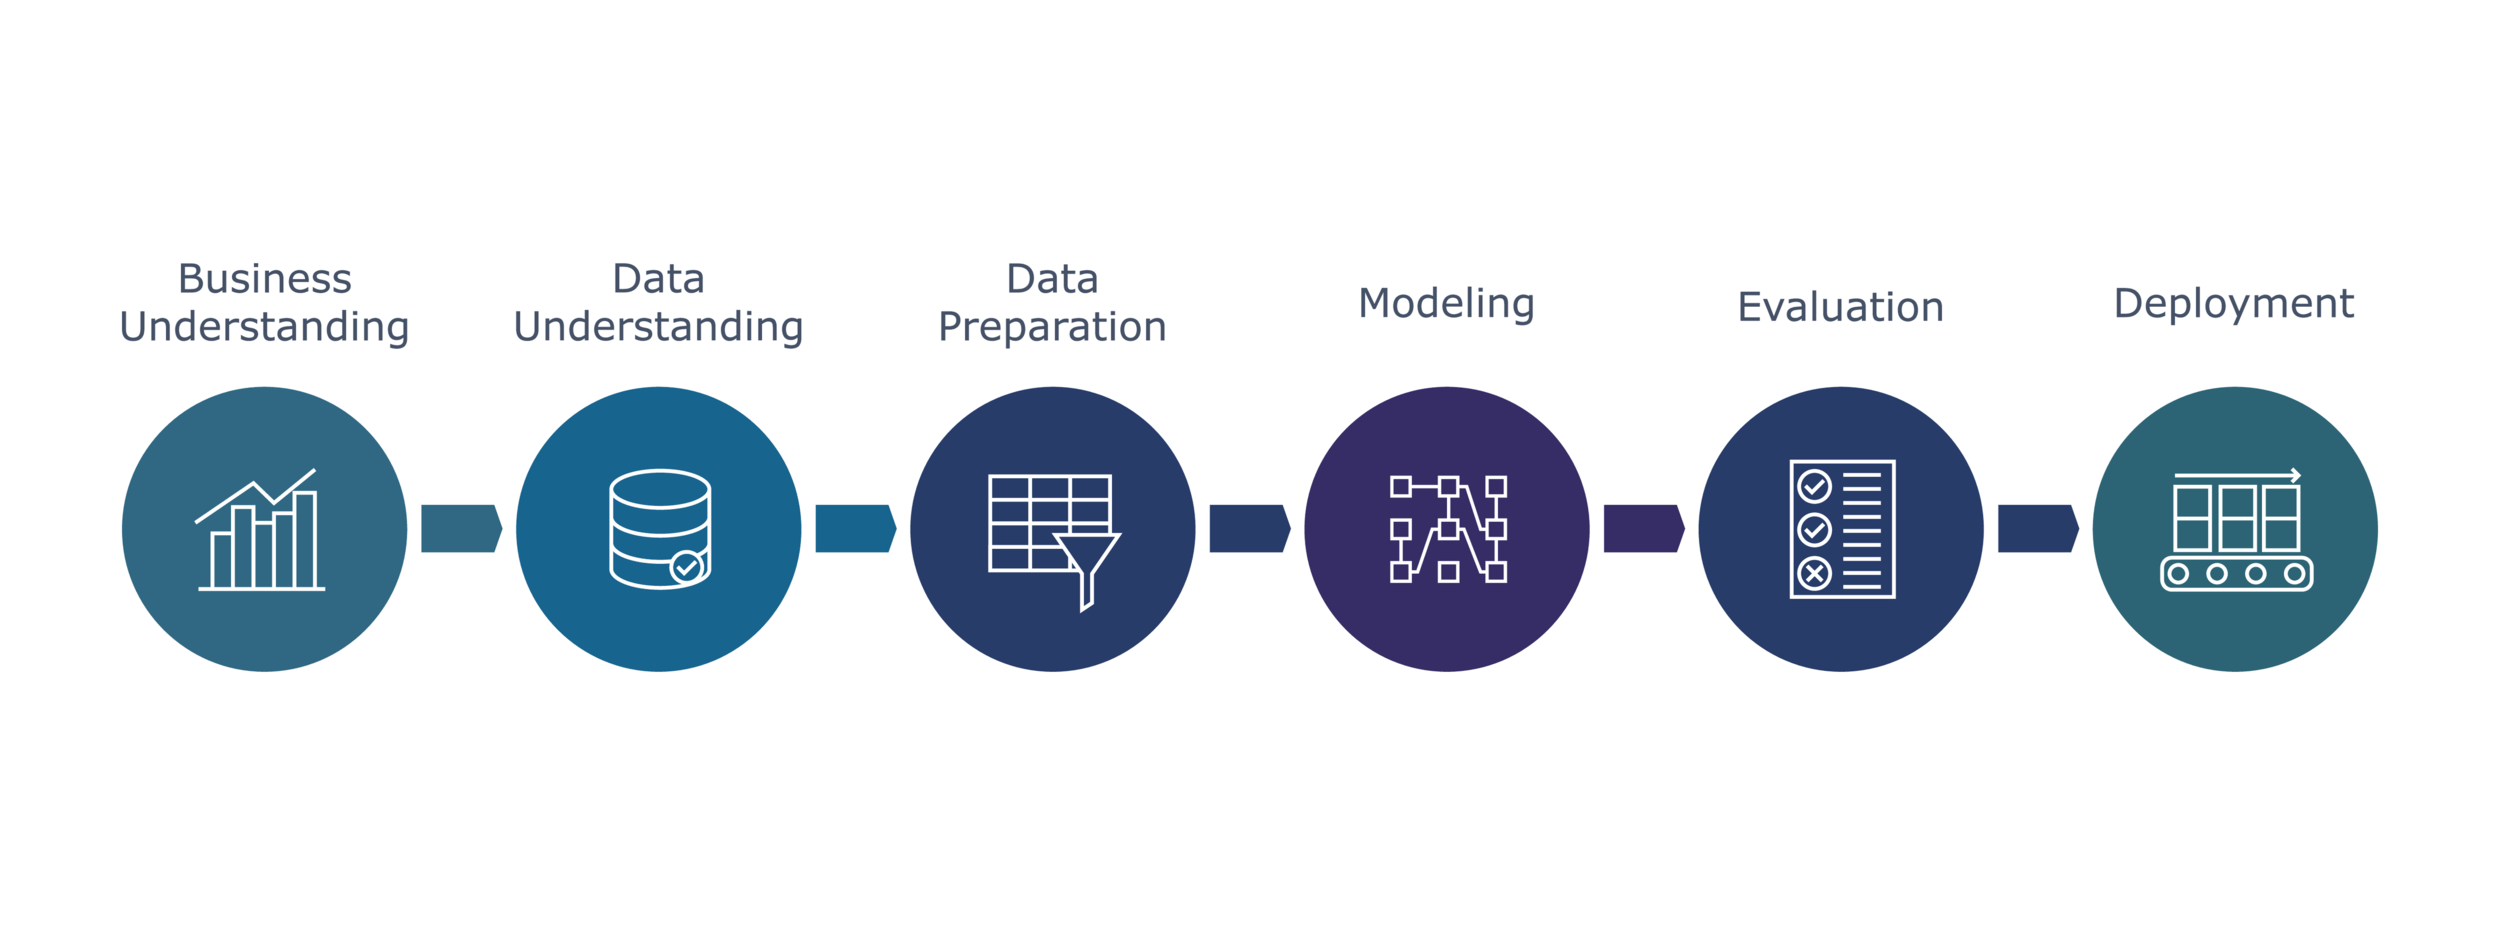
  1. Data cleaning and pre-processing
  2. Selection and training of the model
  3. Evaluation and optimization of the model
  4. Model documentation
  5. Packaging the model
  6. Deploying the model
  7. Monitoring the model
  8. Updating the model


Let me try to explain this through an example for better understanding


Example:
Step 1:

Let’s say a retail company wants to develop a machine learning model to predict which customers are most likely to make a purchase on their website. 

They collect historical data on customer behaviour, such as their browsing history, past purchases, and other relevant information. 

 
Step 2:

They use this data to train a machine learning model, which is able to predict the probability of a customer making a purchase based on their behaviour.


Step 3:

Once the model has been developed and rigorously tested, the next crucial step is its deployment. This entails ensuring that the company can effectively harness it to generate predictions on fresh data. This process might encompass seamlessly incorporating the model into the backend system of their website. In doing so, the system can autonomously furnish customers with personalized recommendations and enticing offers, all grounded in their anticipated purchase probabilities. Moreover, the model can play a pivotal role in categorizing customers into distinct segments based on their projected behaviors, thereby furnishing the company with valuable insights to fine-tune their marketing campaigns.


In the case outlined above, model deployment goes beyond a mere formality. It involves seamlessly weaving the trained machine learning model into the fabric of the company’s existing systems. The model then transforms into an indispensable tool, generating predictions and bestowing actionable insights, contributing to the continuous improvement of the business.

Step 4: Story telling

You know how in movies or TV shows, there’s always that one character who’s really good at explaining complicated stuff in a way that everyone can understand? That’s basically what storytelling in data science is all about!


Picture this: 

You’re a data scientist, and you’ve spent weeks collecting and analyzing data on how people are using a new app that your company just launched. You’ve got all these cool graphs and charts that show usage patterns, user demographics, and other interesting insights. But your boss, who’s not exactly a data whiz, is looking at you like you just spoke a foreign language.

 
Importance of Story telling:

That’s precisely where storytelling comes into play. Rather than merely presenting your boss with an array of numbers and graphs, your task is to elucidate their significance in an engaging and comprehensible manner. Perhaps you employ a playful analogy, likening user behavior to the precarious balance of a Jenga tower—remember, the one where you extract blocks while striving to prevent its collapse.


The essence lies in data science storytelling, which entails transforming arid, technical information into something relatable and actionable. The art involves imparting the narrative embedded in the data, guiding your boss, colleagues, or clients to grasp the true essence of the numbers. And if you manage to achieve this in an enjoyable and captivating fashion, you’ve hit the mark!

Conclusion:

In summary, we’ve explored the various tools and techniques that make up the exciting field of data science. We’ve covered programming, statistics, maths and probability, DBMS, visualization, model deployment, and storytelling.


Each of these components plays a crucial role in the data science process, and mastering them will be key to becoming a successful data scientist.


But don’t worry if it all seems a bit overwhelming at first! With dedication and practice, anyone can become proficient in these areas and make their mark in the world of data science. And if you’re interested in learning more, be sure to check out the master course that we’ve designed here at 1stepGrow. It’s the perfect way to get started on your own data science journey and become job-ready in no time.


So, thank you for taking the time to read this blog. That’s a wrap!